Race Snapshot: IBU WC 6 Women’s Sprint
Another good day for Laura Spector! And Haley Johnson had a strong race as well, for her.
Tagged biathlon, race snapshot, Sprint, women, World CupAnother good day for Laura Spector! And Haley Johnson had a strong race as well, for her.
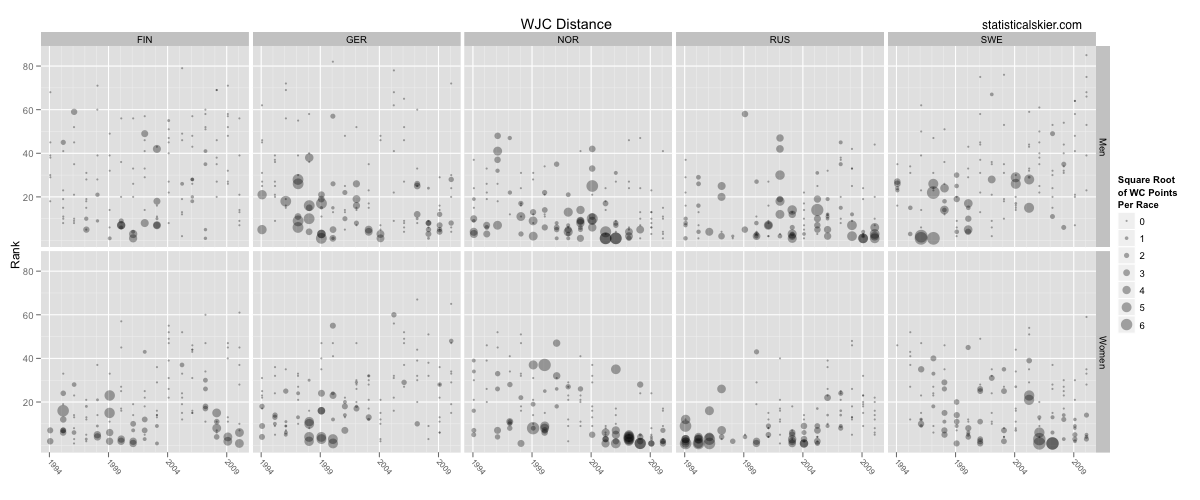
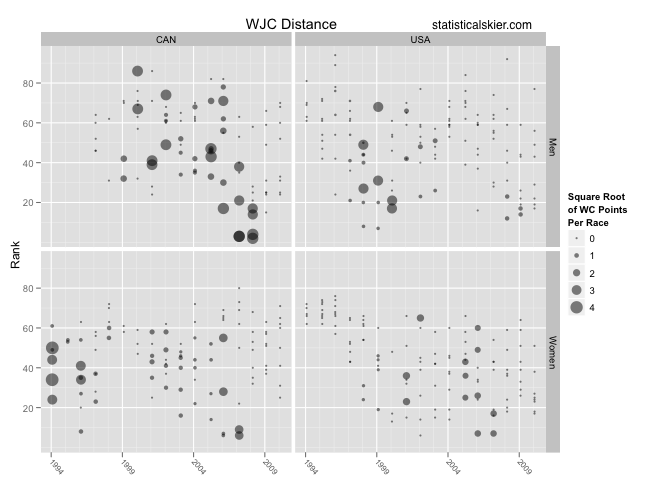
Tagged biathlon, race snapshot, Sprint, women, World CupAs before, we can also look at how the results at WJCs and U23s for different nations match up with each athlete’s future performance in major international competitions. These graphs are constructed in the same manner. For each athlete in the graph I scored their future results in all OWG, WSC, WC or TDS races using standard WC points (100, 80, etc.) and then made the size of the dots correspond to the square root of the value. Taking the square root helps make the scale more compact, otherwise you have a few athletes (i.e. Björgen, Elofsson) with huge values and it becomes hard to distinguish everyone else.
These are the fancy SVGs again, with mouse over text, which may not work in all browsers. Try switching to Chrome, Firefox or Safari if you have problems. Also, be aware that there being a lot more points, many of them overlapping, not all of the mouse over texts are working quite well. This is a work in progress.
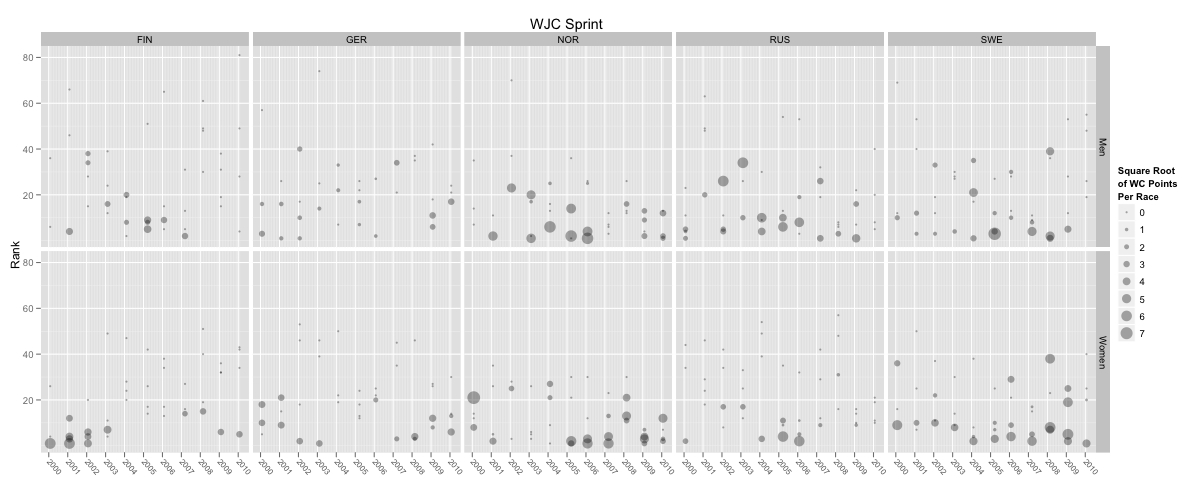
First up are the WJCs distance and sprint results (with vanilla png versions here and here):
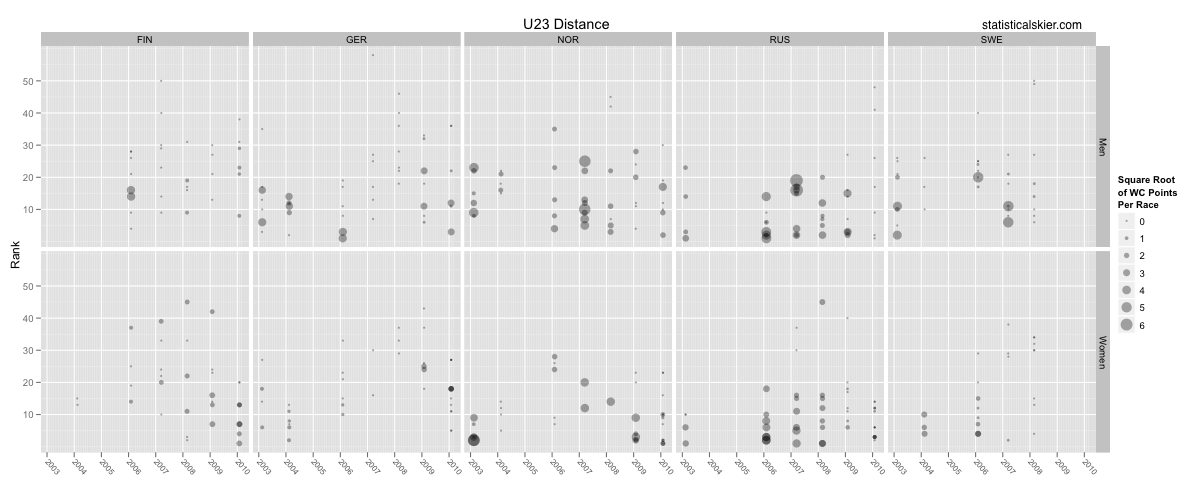
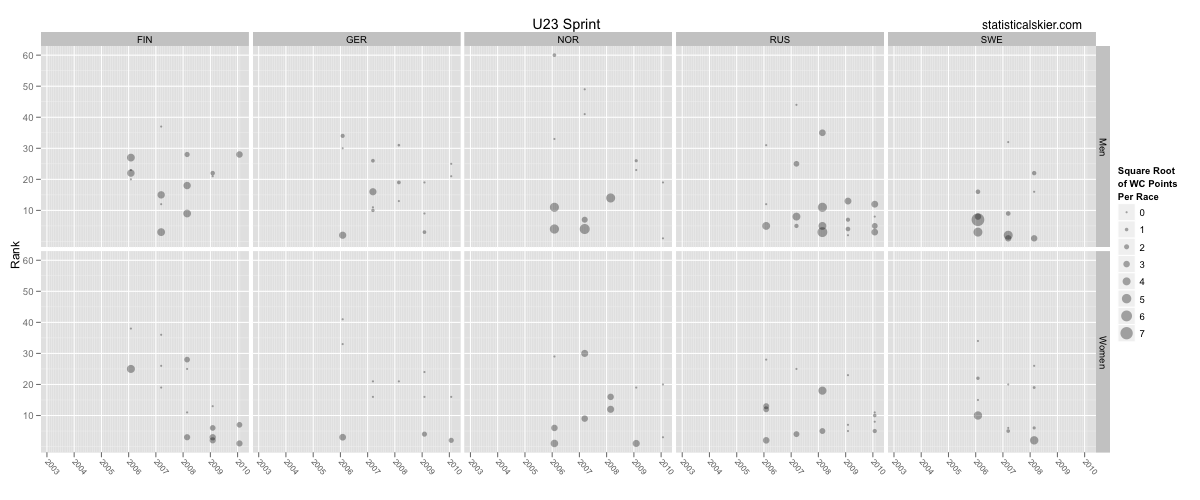
I think what’s interesting to look at with these graphs is the variation in when strong results at WJCs or U23s translate into occasional or regular top thirty performances in major international competitions.
And finally the same for U23s (and the plain png versions here and here):
Continue reading ›
Now it’s time to take a look at some of the bigger nations track records at World Junior Championships and U23s. The graphs will be very similar to the ones I used in my post looking at the USA and Canada. I’m only going to look at results for Norway, Sweden, Finland, Russia and Germany. (Sorry, Italy! Maybe next time.) Obviously, these graphs will be a tad larger than before, so you’ll have to click on them for the full versions.
Beginning with distance results at WJCs:
 There’s a lot of variation, of course, around these trend lines, but a few things jump out. The Swedish men, Russian women and perhaps the German women haven’t fared quite as well lately. The Norwegian women, on the other hand, have been on quite the teat over the last 4-5 years. The Finnish women really fell off in 2004 but have been slowly returning to form, thanks in large part I’m sure to the work of Krista Lahteenmahki.
Most of the other trends (up or down) are less pronounced. The Finnish men may have slid backwards slightly in recent years before having a much improved collection of results last year.
Moving on to sprinting at WJCs, we have quite a bit less data: Continue reading ›
Tagged preview, U23, WJC/U23Hmmm. I might have to write a post on Lowell Bailey next week.
Tagged biathlon, lowell bailey, men, race snapshot, Sprint, World CupOf course, these being competitions focusing on junior skiers, they often are used as a proxy for signaling future performance. I’ve looked at various aspects of this in the past, but there are always new ways to approach this.
What I’ve done here is to take the plots from earlier today and add information regarding whether each particular skier went on to score World Cup points as some later date. In doing this, I’ve made a simplifying assumption: I’ve counted all OWG, WSC, WC and TDS races equally. This means they all get the “standard” WC point assignment of 100, 80, etc. The only exception is overall stage race results, for which athletes receive WC points, but I have omitted these entirely. (If they did well in the overall, they likely did well in the individual stages, too.)
The actual value I’ve attached to each point is the square root of WC points per race. We add up all the WC points for an athlete from OWG, WSC, WC and TDS events (pretending, of course, that these event all award WC points), divide by the number of races for that athlete and then take the square root.  That last step is because otherwise the values are extremely skewed and don’t map well to a visual scale. Specifically, the Marit Björgen’s of the world make it very difficult to detect differences between more ordinary athletes.
Dividing by the number of races helps to account for the fact that the more recent participants in WJC/U23s aren’t as likely to have scored WC points simply by virtue of being younger. This doesn’t completely eliminate that bias, but it helps.
Obviously, this isn’t meant to literally represent WC points, just the rate of top thirty results in the future, on a scale that heavily rewards podiums and top 5’s.
Here’s the results for distance events:
This is a somewhat fancy version with mouse-over tool tips. If your browser doesn’t like this image there’s a plain vanilla version here. Placing your mouse over a point should (assuming I did it right) reveal the athletes and their “square root WC points per race” value. Quite a few of the very small dots are a challenge, though.
Squaring the values on the scale to the right will give you the corresponding “WC points scored per race”. The size of each dot corresponds to the rate at which that athlete scored WC points going forward. Keep in mind that there will be the occasional athlete who has only done 1-2 WC level races but happened to have a good race that day.
For the American women we see contributions (rates greater than zero) by Kikkan Randall, Morgan Arritola, Liz Stephen and to a lesser degree Rebecca Dussault and Abi Larson. For the American men, there’s a huge gap between Kris Freeman and Andrew Newell. They are followed by Noah Hoffman, Andrew Johnson, Leif Zimmermann and Rob Whitney.
The Canadian men’s graph is dominated by the likes of Alex Harvey and Devon Kershaw, followed by Touchette, Butler, Grey, McMurtry, Nighbor and Nishikawa. The Canadian women obviously are topped by Beckie Scott and Sara Renner. A ways behind them are Brittany Webster, Shayla Swanson, the Fortier sisters, Amanda Ammar, Daria Gaiazova, Perianne Jones and Madeleine Williams.
We’ve had somewhat better luck with sprinters: Continue reading ›
Tagged development, Distance, junior, Sprint, WJC/U23, World CupWorld Junior and U23 Championships are just around the corner! The posts today will focus on the US and Canadian teams, subsequent posts will look at some of the other top nations.
WJCs and U23s are rolled into the same week of racing, although they split up the results by age group. U23s in particular is a fairly young event, so there isn’t a lot of data on past performance. In fact, it was cancelled once or twice, and some of the earlier race results are actually tough to find on the web at all. Participation in U23s has also been spotty, with not every top nation sending athletes every year.
For both of these posts I’m going to stick to rank rather than FIS points. I think that it will be clearer, since a lot of people have a rough idea of what a particular finish at WJCs “means”, and I think we won’t lose too much information about how “far back” the athletes were.
Beginning with WJCs and the distance events:
 This was the only combination (WJCs + distance) with enough data for me to feel comfortable including trend lines. The best results for both nations are when they break into the top ten, or perhaps the top twenty. The US men had a fairly long run of mediocre results in the mid-2000s but have returned to “normal” over the last few years. The Canadian men had two years of better than usual results thanks to Alex Harvey, but things have pulled back towards the low twenties since then.
After some pretty terrible results back in the 90’s, the US women had a decent number of top twenty results post-2000 from athletes who are either retired or not quite competitive at the national level anymore (e.g. Lindsey Dehlin, Kristina Trygstad-Saari, Aubrey Smith, Lindsey Williams, Tara Hamilton). The Canadian women had a handful of surprisingly good results in the mid-2000’s (e.g. Amanda Ammar, Perianne Jones and Brittany Webster) but generally they’ve hovered around 40th or so.
As for the sprint events:
 A few differences. Note the steady supply of top twenty finishes for the US women and Canadian men. The US men had a lot of strong sprint results early on (e.g. Ryan Foster, Chris Cook, Leif Zimmermann, Andrew Newell, Torin Koos, Eric Strabel and even Kris Freeman!). Interestingly, those early sprint races were also all freestyle. The US women have had a steady stream of decent sprint results (e.g. Lindsey Williams, Morgan Smyth, Kikkan Randall, Melissa Oram Schwartz, Aubrey Smith, Katie Ronsse, Rebecca Dussault, Ida Sargent, Rosie Brennan, Sophie Caldwell, Sadie Bjornsen).
In general,the Americans tend to do somewhat better (measured by finishing rank) in the sprint events, whereas the Canadians are somewhat the opposite. If you look at the 30 best results for the Americans (men and women), 18 are from sprints. The Americans have twice as many top tens in sprints (12) as they do in distance events (6). The Canadians best 30 results are slightly more evenly split with 16 in distance events and 14 in sprints.
The American’s relative success in sprinting has come almost exclusively in freestyle sprints. Much if this is due to the fact that the US men had so many good sprint results early on when they only held freestyle sprints.
U23s are a bit harder to assess, since the competition at those events has been more uneven over the years. This means that finishing rank can be a litte more deceptive, Â masking weakly competitive fields. Continue reading ›
Tagged can, canada, Distance, junior, preview, Sprint, USA, WJC/U23So there was this post a while back where I looked at the oft repeated CW that Andrew Newell tends to qualify rather fast and then slip back a bit in the heats. Â My goal was just to see whether and to what degree this actually happens. Â It turns out that my attempt to tackle this topic is slightly cursed because I keep messing it up.
The first time around I mistakenly mixed sprint races with 16 and 30 people moving on into the heats. Â More recently, Nat Herz reminded me of something that should have been obvious from the start: people who qualify well are more likely to move backwards simply because there are only so many spots available to them to move up.
For example, if you qualify 3rd, in some respects you more likely to do worse in the heat simply because there’s more room behind you than in front of you. Â To give you a sense for how right Nat was about this effect, check out this plot:

As you can see, it’s much more common for people who qualify well (i.e. top 5-10) to end up losing places, and vice versa for people who qualify slowly. Â However, the blue trend lines probably aren’t as steep as you might expect. Â This is because there’s another general trend working in the opposite direction. Â Skiers who qualify well do actually tend, on average, to be faster skiers. Â So it’s quite common for them to do as well or better in the finals. Â You can see this tendency in the plot by looking at the size of the points, which indicate how often a particular combination occurred.
How do we fix this? Â Simple: rather than looking at the difference between each skier’s qualification and final places, we instead look at how that difference compares to the median difference over all skiers who qualified at that rank. Â For instance, say I qualified 5th and then ended up in 9th after the heats. Â That’s a change of 5-9 = -4. Â We then look at all the people who qualified 5th and calculate the median change across all these skiers, suppose it’s -2. Â That means that I moved back two more places than is “typical” for people who qualified 5th.
Here are plots focusing on the men and women who’ve done at least 15 WC sprint races over the past 4 years or so, complete with error bars: Continue reading ›
Tagged Analysis, andrew newell, heats, qualification, Sprint, technical
