Skip to content

How Often Do Ties Occur?

With the modern chip timing tools used today ties should be fairly rare. They do still happen, though:
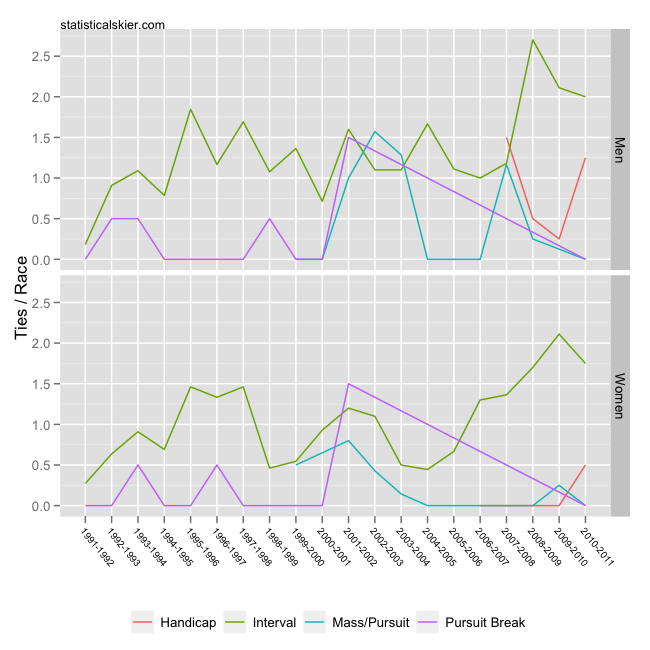
This shows the number of ties per race of each type for WC, OWG, WSC and TDS races for men and women. As we might have expected, there are considerably fewer ties in mass start style races. Amusingly, this is almost certainly entirely psychological. In a mass start or pursuit race you can see the person who’s going to finish with nearly the same time right there next to you! In an interval start race it’s harder to motivate to sprint the last 10 meters when there’s no one around. It shouldn’t be harder, but it is.

Don’t read too much in the Pursuit Break line. That format is really only used in stage races these days, and even then it’s quite rare. The seemingly big jump in 2001-2002 is not terribly ‘significant’, since that format was only ever used ~2 times a season for each gender. With such a small denominator, a small change in the number of ties can make the rate seem to jump a lot.

What’s more interesting to me is the apparent increase in the rate of ties in interval start races. The trend is more noticeable among the women, but the fact that the rates for both men and women have jumped up somewhat may be significant. I can’t think of a good ‘story’ to explain why this may be, though. It could always just be noise, of course, but it’s interesting to ponder…

[ad#AdSenseBanner]

Tagged ,

FIS Point Trends In Olympic Medalists

A while back I responded to a reader requesting that I look into any connections between a skier’s performance at World Juniors and subsequent medal winning.  My conclusions there tended toward the ambiguous, since 2-4 races (from World Juniors) just isn’t a whole lot of information.

But we can also just take medalists and look at how they’ve skied at different ages.  It’s very important to remember that this is inherently one sided: we’re ignoring all sorts of skiers who might have skied just as fast as these medalists at a young age but never won a medal.  If you’re a math geek you’ll recognize this as a distinction between a necessary and a sufficient condition.

I grabbed all the Olympic and World Champs distance medalists since the 2001-2002 season and plotted all of their FIS points (from every race I have):

Continue reading ›

Tagged , , , ,

Tour de France Wrap-Up

The final installment of the 2011 Tour de France graphs, and what a fun race that was this year! Plenty of excitement (for some not so fun reasons) early on and then plenty of exciting racing towards the end. Good stuff…

As usual, you can click on them for slightly larger versions. Here’s the same graph for 2011 broken down by team: Continue reading ›

Tagged , , , ,

WC Split Times: Biggest Losses

The obvious follow-up from the last entry in this series is to look at the folks who have the strongest tendency to fall further behind the leaders as the race progresses. Not surprisingly, this group will include a lot of the more marginal skiers from smaller skiing nations. I did filter out people for whom I only had data from one race.

So keep in mind that fading later in races doesn’t always mean you finished poorly. It just means that you’re considerably further behind the leaders at the end of the race than you were at the beginning. (And check out any of my previous posts using this data for a more detailed description of how to interpret these graphs.)

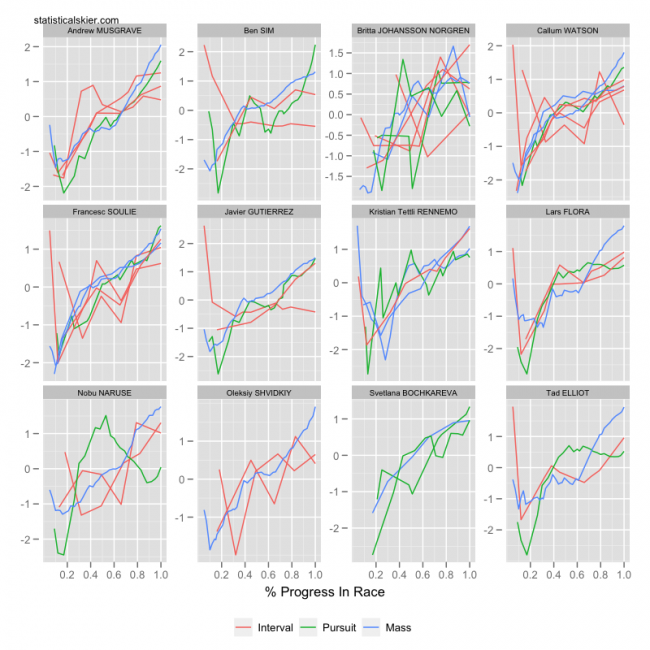
We covered American Lars Flora earlier, noting that he had some health issues during his stint in Europe and so he had a series of tough races over there. Britta Johansson Norgren is one of the more notable skiers to be included in this group. Recall that fading further behind the leaders in a women’s WC mass start or pursuit race was not entirely uncommon last season. But Norgren saw a bit of the same pattern in interval start races as well, which pushed her down the list a bit.

Kristian Tettli Rennemo is a Norwegian I’m not very familiar with, but a quick glance at his results seems to suggest he’s fairly talented. At least, he’s got quite a few WC starts under his belt. Nothing spectacular, but some strong results in Scandinavian Cup and other FIS races.

[ad#AdSenseBanner]

Tagged ,

WC Split Times: Biggest Gains

Continuing with my series of posts looking at some split time data (kindly provided by Jan at WorldOfXC.com), we turn to identifying some folks who tend to ski better (as measured by their % behind the leaders) towards the end of a race than the beginning.

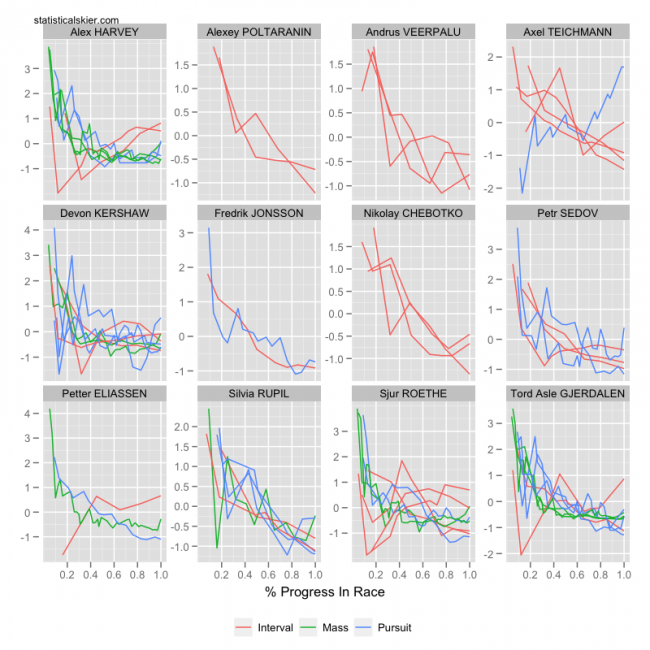
I actually fit a model on this one (gasp!) rather than just exploring the data and making a graph. So after a little bit of fun with some linear mixed effects models, here are the 12 skiers with the strongest tendency to ski closer to the leaders as the race progresses:

Once again, you can click through for a slightly larger version, and the y axis is a highly adjusted measure based on percent back relative to that skier in that race. You can go back and check some of my previous posts using this data for a more detailed explanation of what I’m measuring on the y axis. The basic story is that it’s a relative measure for each skier. So the actual numbers don’t signify anything across athletes, just the overall trends.

You’ll notice that several folks here appear to be dramatically further behind the leaders early in mass start and pursuit races. This is in part a function of how these races play out. Early on, there will often be a very large pack of skiers. If someone, say Alex Harvey, is just sitting comfortably mid pack, at 1-2k into the race he might be as much as 5-10 seconds behind the “leaders” just because the pack is so large and moving so slowly. That can easily translate into a fairly large % back given the small amount of time that has passed.

Still, this model included a variable that accounted for the global differences in race type (interval vs mass vs pursuit) so these skiers are still exhibiting a stronger trend than other skiers, even accounting for the overall differences in race type.

Teichmann’s tendency to pick up the pace during a race is fairly well known (my benchmark here being that even I know about that one!). But maybe some of the other’s are a bit of a surprise to some folks…

[ad#AdSenseBanner]

Tagged , ,

Tour de France Graphs

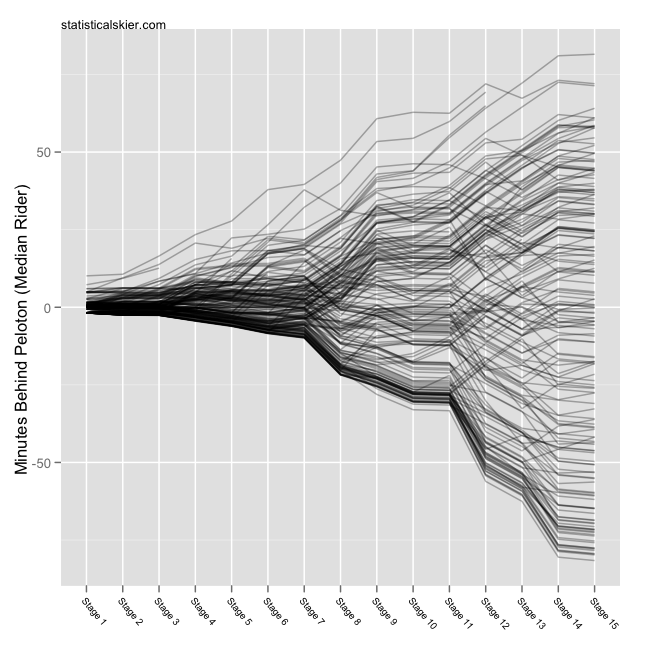
Rest day number two is upon us, so it’s time to update my graphs tracking the race thus far. First the standard ‘bump chart’ showing the GC picture through the first 15 stages:

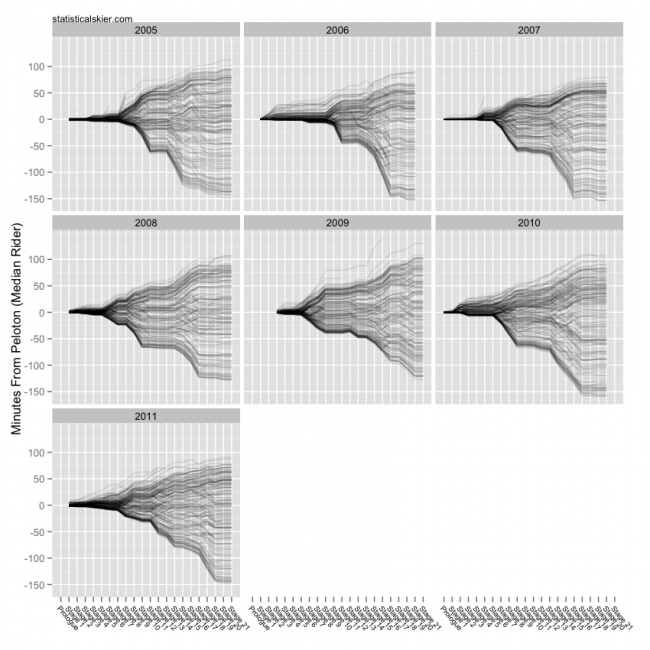
And for comparison, the same graphs for all the Tour back to 2005 (click for larger version): Continue reading ›

Tagged , , , , ,

Tour de France Attrition Rates

Fellow blogger (and, full disclosure, good friend) Cosmo kind of stirred things up a bit with post regarding attrition rates in this year’s Tour. My cycling blogging has been mostly just for fun, as I’m not much of a cycling expert, so I mostly do it to entertain those folks who enjoy mixing sports, numbers and graphs. But statistical commentary on sports draws me like a moth to a flame, so I basically have to weigh in.

At the moment, his commenters are kind of laying into him, and there are some legit criticisms there. But as with anything else on the internet, people are getting considerably more worked up over this than seems reasonable. Would data on attrition due to crashes specifically be more germane? Yep! One of his commenters went out and tried to track down that information on crashes and found that the attrition rate due to crashes does seem considerably higher this year. However, it’s important to note that information on the reason for withdrawals can’t be found in every case, so even that analysis is somewhat incomplete.

That’s not really a criticism, just an observation you can make about any attempt to answer a question using data.

Can I do any better? Not without better data, probably. But here’s something I cooked up that might be interesting. (All data courtesy of cyclingnews.com.)
Using data from the 2005-2011 Tours (the only unified, easily scrapable set I could find on short notice), here’s a graph showing attrition rates (due to all causes) throughout each Tour: Continue reading ›
Tagged , ,