Skip to content

World Cup Field Strength Follow-Up

As promised from last time, a quick look at some similar data broken down by race length. I’ve filtered out the occasional “strange” race length, to focus on just the standard 5, 10, 15, 30 and 50 kilometer distances. The metric is the same: the median number of skiers within a fixed percent of the winner. However, we should be very aware in this case that the median is really nearly the raw data itself. How many 30k mass start races are there per season, anyway? It would be weird to have more than four, and you could only have two.

Here’s the graph for only the interval start races (click for full version):
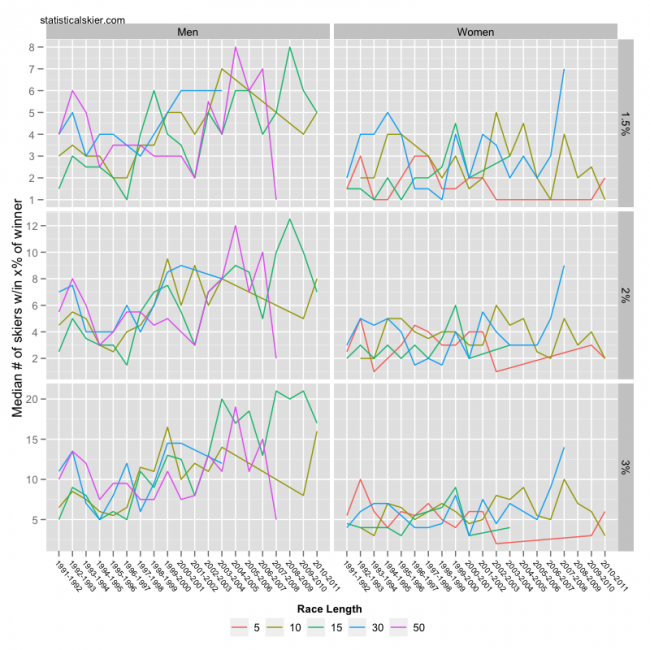
Notice that some interval start race lengths either didn’t occur in a particular season, or were phased out altogether. So the lines may behave strangely, or simply end. Also note that I omitted the smaller percent back values, as they are less useful for interval start races.

The apparent sudden increase in competitiveness of the women’s interval start 30k races, before they were ended completely, is entirely due to a single (and only) race in 2007-2008. So really, those numbers had been holding steady for quite some time. The men’s data displays its own volatility for the same reasons (single races of a particular length in a given season) but the numbers are all generally higher than for the women.

If you figure the men were seeing ~15 people within 3% of the winner, while the women have been seeing ~5 people within 3% of the winner, that’s a pretty major difference in practical terms. Again, think of it as a game of musical chairs. When the music stops for the men, there can be as many as three times as many skiers vying for a place to sit!

As I laid out in my previous post, I think this difference is mostly a numbers game (ha!). Namely, while 3-4 decades seems like a long time for women’s skiing to have developed, it really isn’t, at least compared to the cultural and practical infrastructure built up around men’s athletics over previous centuries. So if you don’t like this state of affairs, send some money to Fast And Female, be patient, and check back in 20 years or so. I’ll guarantee you things will be better.

Finally, here’s the same graph but for mass start (and pursuit) races: Continue reading ›

Tagged , , ,

Are Women’s WC Fields Really ‘Weaker’?

I received an email recently asking about field strength for the men’s and women’s WC fields, particularly as it applies to mass start races. Lately we’ve seen the men’s field engage in a fair bit of pack skiing, whereas the women’s field strings out more quickly.

First, I want to dispatch with a common bit of lazy rhetoric in this area. Saying that the women’s field is ‘weak’ is not the same as saying the women are weak. I’m not sure what other people mean, but what I mean by a ‘weak field’ is simply that there are fewer skiers able to finish close to the leader. To say that there are fewer women able to (nearly) match the performance of Marit Bjørgen than there are men who can (nearly) match the performance of Petter Northug is not to say that the women are somehow less talented than the men. To the extent that this happens, I consider it primarily a legacy of gender inequalities in sports and society in general. We’ve made a lot of progress in bringing more women into this sport, but professional women’s skiing still must be several decades younger than men’s professional skiing.

With that caveat out of the way, let’s look at some data.  My preferred metric for this sort of thing is to look at the number of skiers within a fixed percent of the leader. It’s sort of a ‘musical chairs’ analogy: the more skiers you have fighting for a fixed number of chairs, the more ‘competitive’ the field. Let’s begin with interval start races (click for full version): Continue reading ›

Tagged , , , , , , ,

Predicting World Cup FIS Points (con’t)

On various occasions I have looked at FIS point race penalties, in a very general, roundabout way.  Most recently, I looked at whether the FIS points you get in a non-World Cup race accurately reflect what you would have scored if you had raced in a World Cup race.

The answer appeared to be: kind of.  At least for the OPA Cup and Scandinavian Cup circuits.  Specifically, we do see roughly the sort of relationship we’d hope to, though there is considerable variation from skier to skier.  This is an important example of the difference between something being true on average, and being true absolutely in every case.

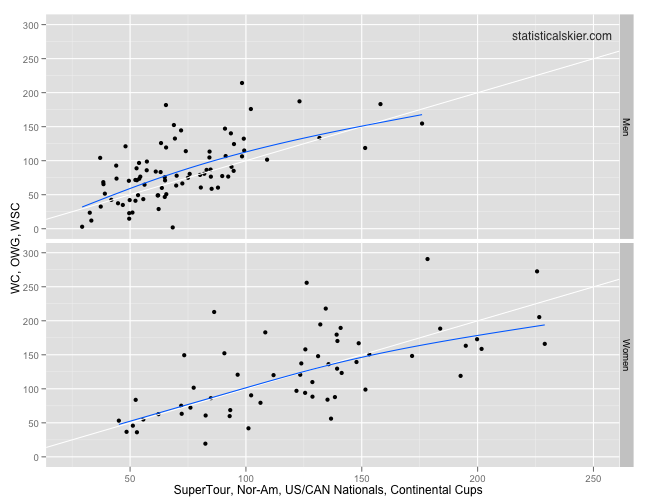
One interesting extension of that post is to look at top North American races and see if we find a similar relationship.  The methodology is exactly the same, only the races I’ve used have changed.  I looked for skiers who did at least one “minor” race (Super Tour, Nor-Am, US/CAN Nationals, Continental Cups) and at least one “major” race (World Cup, Olympics, World Championships) in a single season.

This leaves us with an even smaller collection of athlete/season data points than before: generally only 5-15 skiers per season.  We also have the same problem of small numbers of races.  A skier may have done a bunch of domestic racing and then only one World Cup in a season.  So all the same caveats apply.

Here’s the graph:

As you can see, there are many fewer data points here.  However, the end result is basically the same.  The overall correlation between median FIS points has, if anything, improved over the OPA/SC cup case.  However, the high degree of variability has remained as well.

Tagged , , ,

Predicting FIS Points For World Cup Races

The title of this post has dramatically over-promised on the actual content.  Sorry.

I’ve talked a little before about race penalties.  Since race penalties are specifically intended to adjust for the strength of the field, I thought it would interesting to think up some way to see how well they do that.

Everything having to do with FIS points revolves around measuring people relative to the fastest skiers in the world (i.e. by definition, people who win World Cup races).  Someone racing in, say, a domestic collegiate race might wonder whether the FIS points they get that day actually reflect the FIS points they’d get if they had done a World Cup race instead.

If FIS points work as advertised, this should generally be the case.  Of course, no system is perfect, but we should at least expect a reasonable correlation.  Is that what we get?  Let’s see… Continue reading ›

Tagged , , ,

New Zealand Continental Cups Sprint

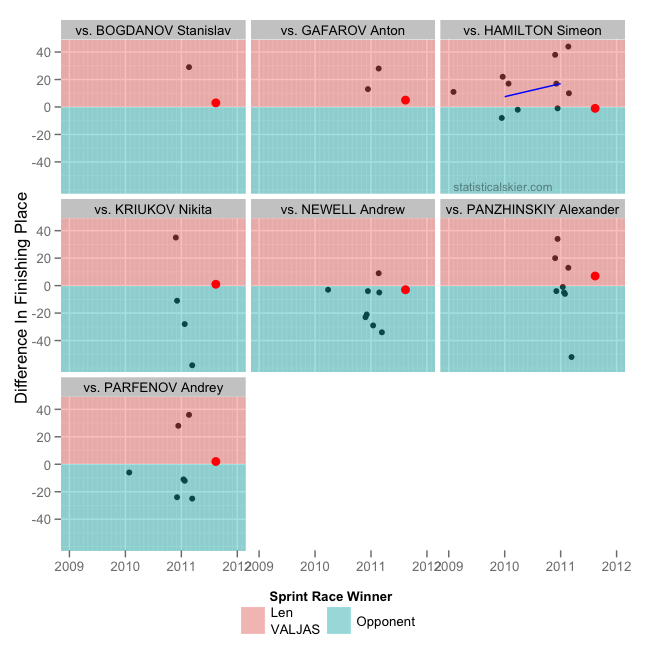
Continuing on in our over-analysis of the recent New Zealand FIS races, we turn to the sprints. It’s much harder to do anything sensible with these races (even given that I’ve over-analyzing things!) since the fields are so small even the difference in placing between specific skiers is potentially misleading. However, just for fun let’s focus like last time on a younger sprinter, Len Valjas:

Again, this is the difference in finishing place between Valjas and a selection of folks from the New Zealand sprint race. Positive values mean Valjas won and vice versa. Note that he finished a lot closer to some of these Russians that he normally does, but again, that may be a function of the small field. It’s hard to do much analysis on these sorts of races without the heat times.

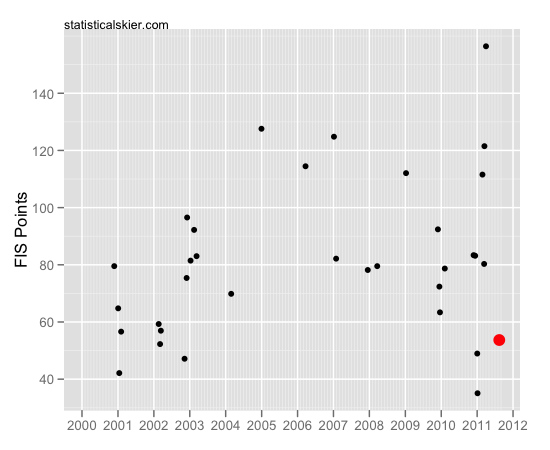
My only other note is that Kris Freeman slightly underplayed how good his sprint FIS points were from this race. Here’s a graph of all the sprint qualification results I have for him with the New Zealand race in red:

Definitely good sprint FIS points for him, but it’s more like the 5-6th best all time. Of course, a lot of those are from a long time ago in potentially very different sprint race formats, distances and courses.

[ad#AdSenseBanner]

Tagged , , , ,

New Zealand Continental Cups

Hey, the first international ski races of the 2011-2012 season took place recently in New Zealand! They are officially FIS sanctioned races, but my impression is that they have a bit more of a training camp time trial feel to them. The Americans, Canadians, some Russians, and then an assortment of Japanese, Korean, and locals (Australia + New Zealand) are spending time down at the Snow Farm. The fields are small, no one is in top form and probably everyone is treating them as training rather than a ‘serious’ competition.

But heck, let’s (over) analyze them anyway, just for fun. These will be very short, narrowly focused posts on these races. The men did a mass start 15k classic race (no Russians). I suppose it’s interesting that Newell finished second, which is nominally pretty good for him in a distance race, but of course it’s hard to read much of anything into that. I’m generally more interested in the younger skiers. Take Noah Hoffman, for instance:

This graph shows how Hoffman has fared against these specific skiers (a subset of the folks in the New Zealand race) over time. The New Zealand race is in red. That appears right in line with how he fared against Freeman last season, so that’s a good sign. In general, he’s been faring better against Newell over time, but this particular race was a bit against that trend. Given that Hoffman was about as far behind Freeman as he normally is, I’d guess that’s evidence for this being a strong race for Newell rather than a weak one for Hoffman.

The corresponding women’s 10k classic mass start was interesting for data nerds like myself. It consisted of Justyna Kowalczyk and only 5 others (it’s possible other folks raced who don’t have valid FIS licenses, so they won’t show up on the official results) from Japan, Korea and New Zealand. Obviously, this made for a somewhat uneven field. Kowalczyk won by around 4 minutes.

This immediately gets someone like me wondering how that margin of victory stacks up historically. In this case, second place finisher Sumiko Ishigaki was ~13% back. That’s the third largest percent back by a second place finisher that I could find in a FIS sanctioned women’s race (out of 2691 total). That means that I found two races with larger margins between first and second place!

One of them is impressive, but plausible, being another instance of a tiny field. The other, the largest, is so outlandish that I spent a while trying to decide if it wasn’t in fact an error of some sort. I’ve mostly decided that it must be a mistake and the winning time was really 34:32 not 24:32. Perhaps a reader will fill me in on the details…

[ad#AdSenseBanner]

Tagged , , , ,

Top Female Juniors

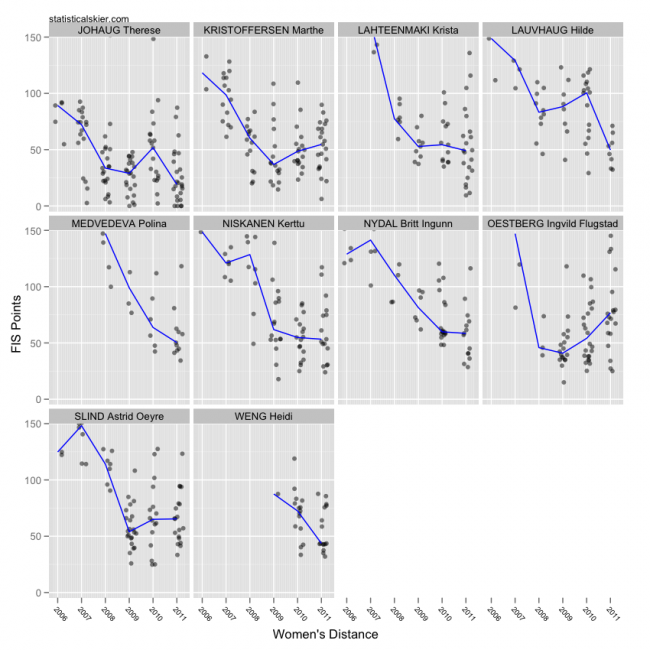
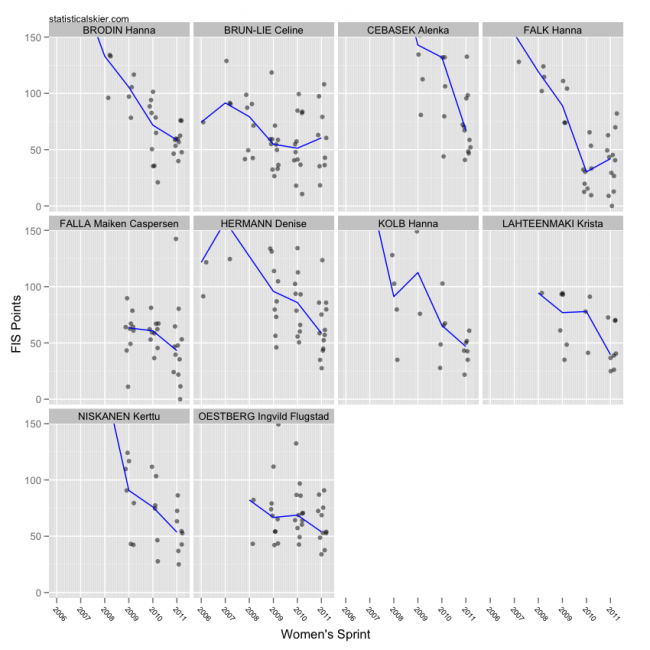
Once again, I use the term junior a little lightly. That’s especially true for the women, since it’s a bit more likely to see younger women establish themselves on the WC scene. So some of these names aren’t really “up and comers” anymore, but they are still quite young. As before, we’re using FIS points, with all their limitations, and only looking at folks who were (approximately) 23 or so last season. First the distance folks:

Obviously Johaug stands out here, as do Kristoffersen and Lahteenmaki to a lesser extent. I would also note the large number of Norwegian women. Something tells me that the Norwegian women may be quite dominant for a while.

It’s also worth noting that while she had enough good races last season to count her among the better younger women, Oestberg’s typical result has slipped somewhat two years in a row. I’m also intrigued by the fact that Lahteenmaki, while making a significant splash last season, did so mainly by having a sequence of very good races, but she also had plenty of slower ones, meaning her typical result didn’t change much. I’m sure she’ll be looking to be more consistent next year…

As for the sprinters:

Again, this is FIS points, which for sprinting means we’re only measuring how fast you are in qualification. So this is a very rough performance measure. Notice how similar the collection of names is!

[ad#AdSenseBanner]

Tagged , , ,