Skip to content

Season Openers In Germany

It’s pretty crazy to think about, but the 2011-2012 FIS racing season officially got under way last week with some sprint races in Germany. I don’t know much about the circumstances of the venue, but I’d love to know how they put these races on. I’m guessing artificial snow? Still, they claim to have used a 1.5km course, so they weren’t skimping on the length.

Technically, I suppose the season kicked off earlier in the summer in New Zealand. But this blog has a severe Northern Hemisphere bias.

The field at these races was basically only Germans. My main interest is in how Nicole Fessel did. She had a dramatically improved season last year, so I’m curious how she follows it up this year. So let’s look at how Fessel did in qualification versus some of the top skiers in this race that she’s faced before: Continue reading ›

Tagged , ,

Who’s Producing Fast Young Male Skiers?

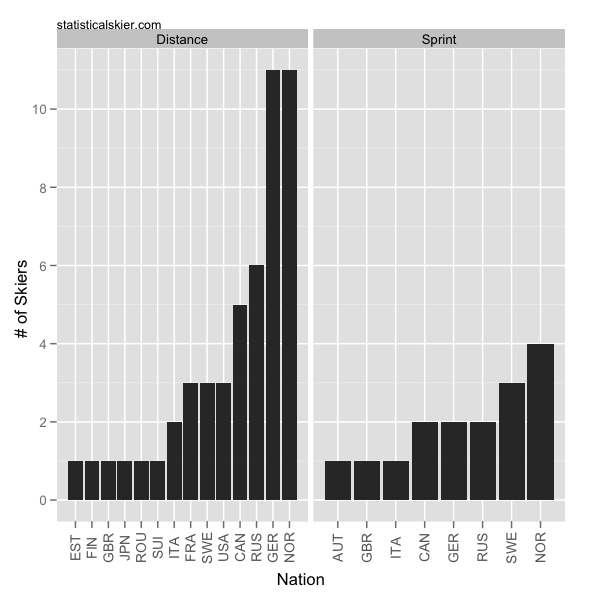
A quick follow up to my previous post on the same topic for women. Swap Germany for Russia, and otherwise the answer is largely unchanged:

Once again, this is the number of skiers born since 1988 who’s best FIS points results last season averaged better than 50 FIS points. I used a more strict cutoff with the men, since their FIS points tend to run lower than the women. As before, sprinting is a bit less lopsided. I was really surprised by the large number of young German men, many of whom I’m unfamiliar with.

Of course, FIS points are an admittedly crude measure, so perhaps this is overestimating things.

Tagged , , ,

Who’s Producing Fast Young Female Skiers?

Answer: Norway. And Russia.

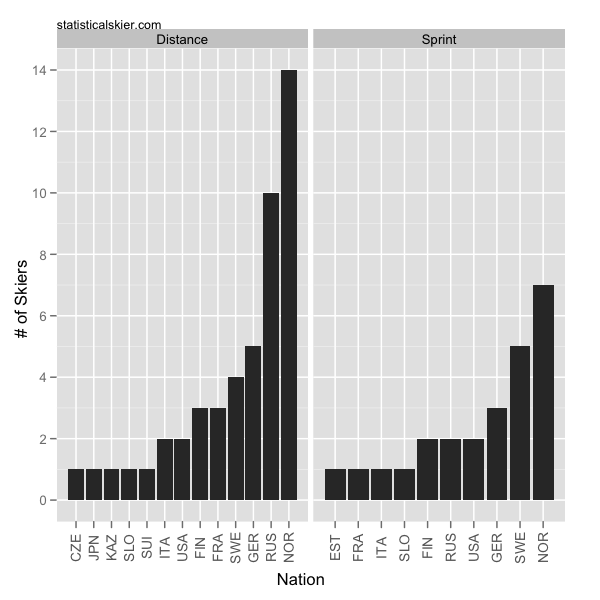
Looking forward to the upcoming season, I’m somewhat astounded by the number of talented young Norwegian women on the horizon. Here’s a quick snapshot of what I’m talking about. I took female skiers born no earlier than 1988 who did at least 3 FIS races last season, and averaged their best few results in both sprint and distance. Then grouped them by nation according to the number of skiers with an average of less than 75 FIS points:

14! The Russian women aren’t far behind with 10. And an average of 75 FIS points (among only your best races) isn’t that strict a cutoff, really. Things are a little less lopsided in sprinting, but Norway leads the way there too.

For the record, the American women here are Jessie Diggins and Sadie Bjornsen (distance) and Ida Sargent and Sadie Bjornsen (sprint).

[ad#AdSenseBanner]

Tagged , , , , ,

At What Age Do Skiers Peak?

If you imagine a typical skier’s career in FIS points, it will often follow a vaguely parabolic shape: they get faster for a while and then get slower for a while.  Somewhere in between there they “peaked”.  Our goal in this post is to estimate approximately when this occurs for each athlete and then see what we can learn from this, if anything.

To estimate each athlete’s peak, I simply fit a trend line to each skier’s age vs. FIS points data and look for the minimum of that curve.  (Lots of technical details have been omitted for your sanity and for mine.)

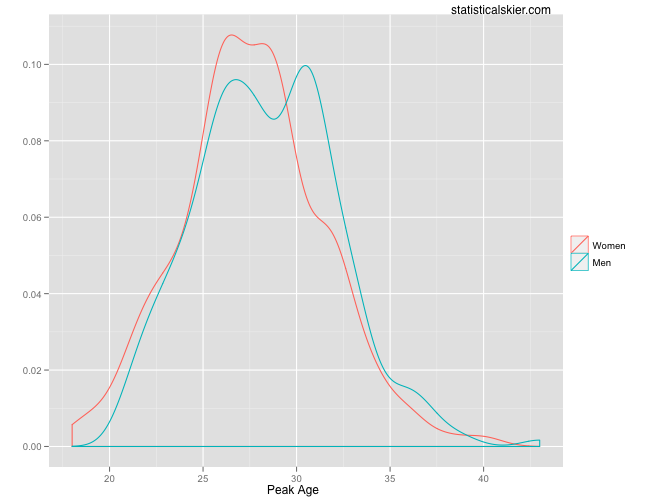
Some people are never quite a fast as they were when they were 22.  Others don’t really get going until they’re in their late 30’s.  But most skiers peak sometime between 25-30.  At least, that when they have their best results internationally.

Here’s another interesting way to look at this, the technical details of which I’m again going to omit.  The following plot shows the average tendency for skiers to be faster or slower at a particular age than the year before.  Negative values means they’ve tended to have improved over the past year, positive values mean they’ve tended to become slower: Continue reading ›

Tagged ,

Climb To The Castle – Previous Year’s Comparison

Since earlier this week I gave some context for what people’s performances would roughly translate into compared to how Kris Freeman and Liz Stephen skied on the WC last season, I thought I should provide some context for my context, so to speak.

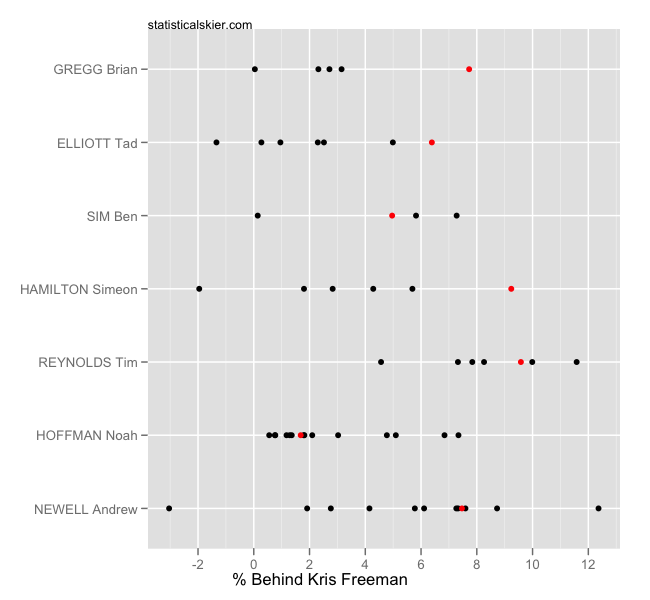
So the following two graphs show how various folks from last years Climb To The Castle did versus Freeman and Stephen (just to keep things consistent, even though Stephen didn’t win last year) in the rollerski race and then how they did against them during the actual ski season. You will see that there is quite a lot of variation. First the men:

The red indicates their performance versus Freeman in the Climb to the Castle, and the black points are actual ski reason in the subsequent season. The occasional negative values (when folks beat Freeman) are generally from a Prologue, but not always. Noah Hoffman did the best against Freeman in the rollerski race, and that pattern mostly continued in the ski season. However, some people had much better luck against Freeman on snow than on pavement. This largely speaks to the pre-season nature of the Climb to the Castle and the vagaries of rollerski racing (i.e. different ski speeds). As for the women: Continue reading ›

Tagged , ,

Climb To The Castle – Women

Same story as last time, only the women this time. Kikkan Randall may have made a better benchmark, but Liz Stephen is no slouch in WC distance events either.

As before, all of this is highly approximate.

I’ve taken Stephen’s races from last season, removed some of the least comparable (prologue’s for example), and then calculated where in each of these WC races folks would have placed if they finished the same percent behind Stephen as they did in Climb to the Castle. Blank entries in the table indicate that that person’s percent back places them after the last WC skiers in that race.

If you’re wondering about the runs of identical places in the columns, the reason is that there are often some large time gaps at the very back of the field, so there are a wide range of percent backs that might fit between second to last and last, for instance.


Name 11-20 12-11 12-18 02-19 02-26 03-05 03-12
STEPHEN 25 48 18 55 24 16 28
SARGENT 57 58 34 68 38 34 47
GERAGHTY-MOATS 75 62 47 48 43 58
DREISSIGACKER 79 63 49 50 48 63
SPECTOR 84 63 52 49 67
EGAN 86 53 49
DUNKLEE 86 53 49
KILLIGREW 86 49
DROLET 86 51
ATTALI 86 51
Tagged , ,

Climb To The Castle – Men

This annual rollerski race was this past weekend, and as usual attracted a fair number of good domestic skiers. With the US Ski Team attending, it’s a good chance for folks to test themselves against folks like Kris Freeman. As with any other race, it’s natural to ask what the results “mean”. There are no concrete answers to that kind of question, but we can provide some context. For example, since Kris Freeman is essentially the benchmark for US distance racers unable to get to Europe that often, we can look at how people’s performance against him would compare in a WC race.

All of this is highly approximate, of course.

I’ve taken Freeman’s races from last season, removed some of the least comparable (prologue’s for example), and then calculated where in each of these WC races folks would have placed if they finished the same percent behind Freeman as they did in Climb to the Castle. Blank entries in the table indicate that that person’s percent back places them after the last WC skiers in that race.

If you’re wondering about the runs of identical places in the columns, the reason is that there are often some large time gaps at the very back of the field, so there are a wide range of percent backs that might fit between second to last and last, for instance.


Name 11-20 12-11 12-18 01-03 01-08 02-19 02-27 03-01 03-12 03-19
FREEMAN 9 23 25 11 38 57 29 24 26 20
BURKE 15 26 27 33 39 64 31 28 32 26
HOFFMAN 36 44 34 38 40 75 43 41 45 29
NEWELL 53 60 41 48 40 80 50 49 51 32
ELLEFSON 71 62 44 52 81 53 53 58 35
ELLIOT 80 67 57 58 84 60 60 62 42
O BRIEN 95 75 64 84 65 69 48
HAMILTON 99 76 64 71 49
JOHNSON 102 77 74 49
LAPIERRE 102 77 75 49
Tagged , , ,