Sprint Length (By Time)
By request, we’re looking at how the length of World Cup sprints has changed over time. Specifically, since the length in time of the effort is really more meaningful than the length of the course in terms of distance, that’s what we’ll consider.
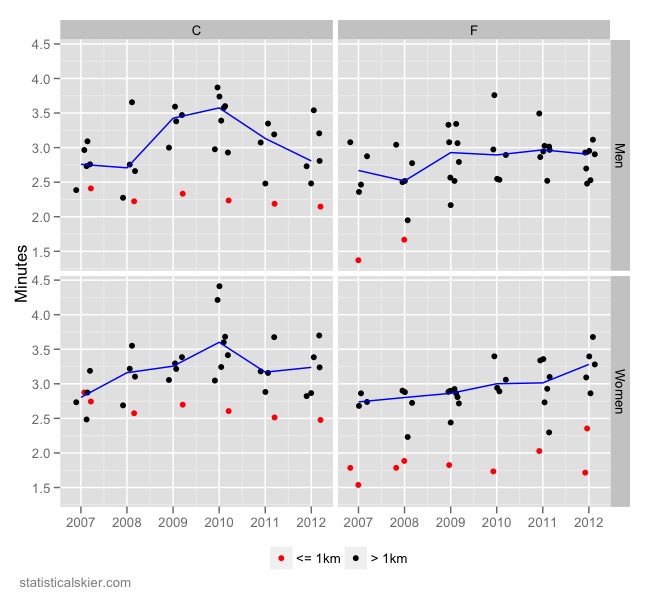
So the following graph shows the average of the top five qualification times for each World Cup (and Olympic and WSC) sprint race for the past six seasons or so:
The races in red are all, roughly speaking, short courses. Many are city sprints. The actual cutoff I used wasn’t exactly 1km, but you get the idea. I was just trying to highlight the fact that there’s a set of sprint courses that are quite a bit different than the rest. But snow conditions, weather and hilliness can create a fair bit of variation themselves, as well.
The trend line in blue represents the median time per season (excluding the shorter courses in red).
I’d say that the women’s freestyle sprints got a bit longer last season, but other than that things are mostly unchanged. In fact, it seems like they have the men’s freestyle sprint courses pretty well dialed in at 2.5-3 minutes or so. The men’s classic courses look like they got a hair longer in 2009 and 2010, but have come back down on average.
Three minutes seems like a reasonable length to me (although I’d be curious what racers and coaches feel like is the “optimal” length for a sprint race effort), and we’re certainly in that general ballpark. Perhaps the women’s classic courses could be shortened slightly, but that’s the only adjustment I’d make, I think, assuming the women’s freestyle times drop back down again next season.
Whether or not you like the really short courses is an entirely different matter, of course.
Tagged Sprint, times, trends, World Cup