A commenter asked about whether I could take the data from this post and look at trends over time. Â The answer, of course, if yes!
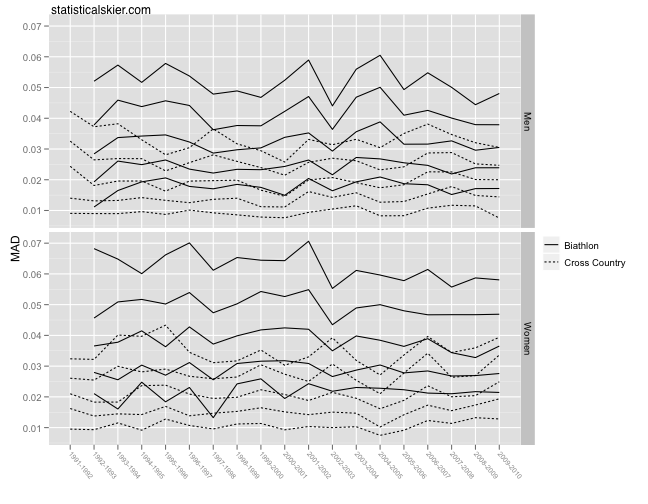
The statistic of interest here is median absolute deviation (MAD), which is a measure of variability. Â In this case, we’re calculating a MAD value for each skier and each season on their percent back results. Â So each skier get a MAD value for each season they compete in that measures how variable their results were.
In my previous post, I just compared the distributions of these values for XC and biathlon skiers, showing of course that biathletes’ results are considerably more variable. Â My commenter wanted to know if these values have changed much over time.
What I actually did is to plot some quantiles of each distribution over time, and extended the time frame back to 1992 or so. Â What this means is that each line represents the trend for a particular quantile over time. Â For instance, the middle line for both XC and biathlon represents the median, or 50% quantile. Â The quantiles plotted are 10%, 25%, 50%, 75% and 90% (10% is the bottom line, 90% is the top line).
Graph below the fold:
 Obviously, these values do bounce around a bit from year to year. Â However, I’d say that for the most part they’ve remained fairly stable. Â It looks to me like the XC men might be seeing a slight decline is variability over the last 4-5 seasons, and conversely the women may be seeing a slight increase. Â These changes are very minor, though.
[ad#AdSenseBanner]
Post a Comment