Fellow blogger (and, full disclosure, good friend) Cosmo kind of stirred things up a bit with post regarding attrition rates in this year’s Tour. My cycling blogging has been mostly just for fun, as I’m not much of a cycling expert, so I mostly do it to entertain those folks who enjoy mixing sports, numbers and graphs. But statistical commentary on sports draws me like a moth to a flame, so I basically have to weigh in.
At the moment, his commenters are kind of laying into him, and there are some legit criticisms there. But as with anything else on the internet, people are getting considerably more worked up over this than seems reasonable. Would data on attrition due to crashes specifically be more germane? Yep! One of his commenters went out and tried to track down that information on crashes and found that the attrition rate due to crashes does seem considerably higher this year. However, it’s important to note that information on the reason for withdrawals can’t be found in every case, so even that analysis is somewhat incomplete.
That’s not really a criticism, just an observation you can make about any attempt to answer a question using data.
Can I do any better? Not without better data, probably. But here’s something I cooked up that might be interesting. (All data courtesy of
cyclingnews.com.)
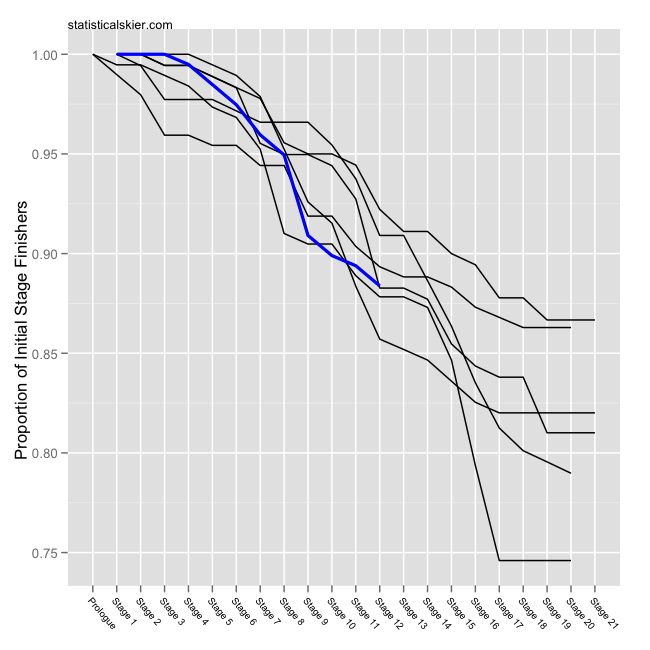
Using data from the 2005-2011 Tours (the only unified, easily scrapable set I could find on short notice), here’s a graph showing attrition rates (due to all causes) throughout each Tour:
This is tracking the proportion of finishers of that Tour’s initial stage. Â 2011 is shown in blue. I find this look interesting because you can compare the rate of decline across multiple stages.
Only a few Tour’s have had higher attrition through Stage 12, and one is 2007, one of the “hard mountain stages early” years. But even so, the total number of riders gone doesn’t seem dramatically larger this year, even if many more than usual have been sidelined due to crashes.
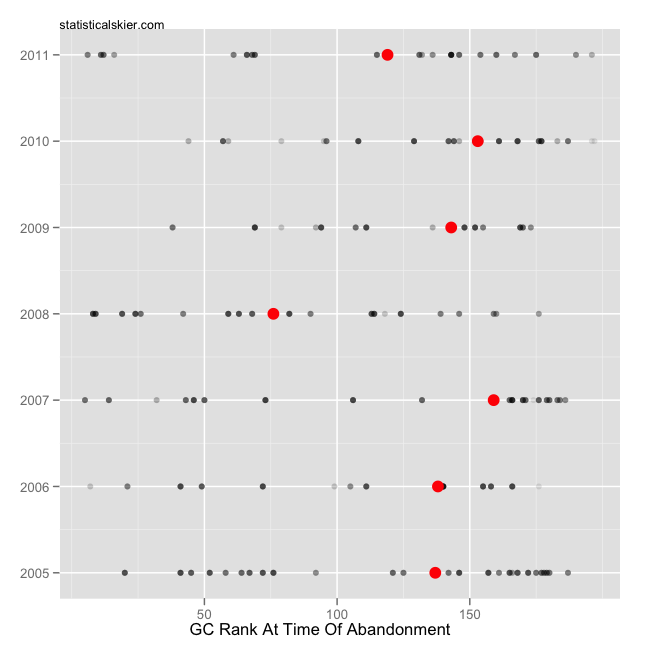
Finally, here’s a simple graph showing the GC rank of each rider at the time of abandonment. (Measured by last completed stage, not “on the road”.)
The red indicates the median for each year’s Tour. While the typical rider we’ve lost this year isn’t dramatically higher ranked than those in the past, measures of center are potentially misleading in this case. Note that we’ve had several dropped riders coming from the top 25, which seems more unusual, but not unprecedented.
[ad#AdSenseBanner]


{ 1 } Trackback
2tradespeople
Post a Comment