An old Dartmouth teammate of mine contacted me recently and asked if I’d be interested in looking at some triathlon data. Â He has some ulterior motives here, as his sister is a very good triathlete. Â Since he volunteered to gather the data himself (I believe from triathlon.org mostly) and send it to me, I just couldn’t say no.
My friend, Adam, had a very specific question, which I’ll get to in a second, but it turned out that there’s a bunch of interesting stuff to look at in these data, most of which I can’t get to in one post. Â So I’ll be violating my nordic skiing theme some more with triathlon data.
First some background on triathlons in case you’re unfamiliar with the sport. Â We’re discussing the Olympic distance triathlon (1.5km swim, 40km bike, 10km run). Â Other than the distances, a major difference between these triathlons and the iconic Ironman variety (e.g. the one in Hawaii) is that drafting is legal during the bike. Â This means that you are allowed to ride right behind people, which conserves a ton of energy.
An athlete’s time can be broken down into the five parts of the race: Swim, Transition 1 (T1), Bike, Transition 2 (T2) and Run. Â The transitions are exactly what they sound like: you have to switch gear in a sort of pit stop area.[1. Sadly, it appears the times in the data have been rounded to the nearest second. Â This means that when I add the five stage times I’m off by +/- 3 seconds from the recorded total time. Â I doubt this will influence what I’m doing here drastically, but it obviously isn’t ideal.]
As I mentioned, Adam’s question was very specific: Suppose you finish the biking portion of the race just behind several other competitors. Â Is it better to rush through T2 in order to start the run ahead of some of them, or should you “chill” during T2.
If you’ve never done triathlons, this might seem like a strange question. Â Shouldn’t you always go as fast as you can? Â I mean, it is a race after all. Â I’ve never done triathlons, but based on what I know, switching activities can be pretty jarring both physically and mentally[1. Seriously, go try it sometime. Â Bike 40km as hard as you possibly can and then immediately switch to running 10km. Â Trust me, it’ll feel pretty awkward.]. Â So it seems reasonable that there might be a school of thought within the sport that it’s worth being 5-10 seconds slower through a transition if you feel like the added time helps you adjust to the new activity more quickly.
Of course, what this question calls for is some sort of an experiment, and we can’t do that. Â So all we can do is look at what has happened and then be very cautious about what it might mean. Â First, though, we need to get our bearings a bit with the data. Â Adam sent me results for 28 races (14 men/14 women) containing each athlete’s name and their times for each portion of the race: Swim, T1, Bike, T2, Run.
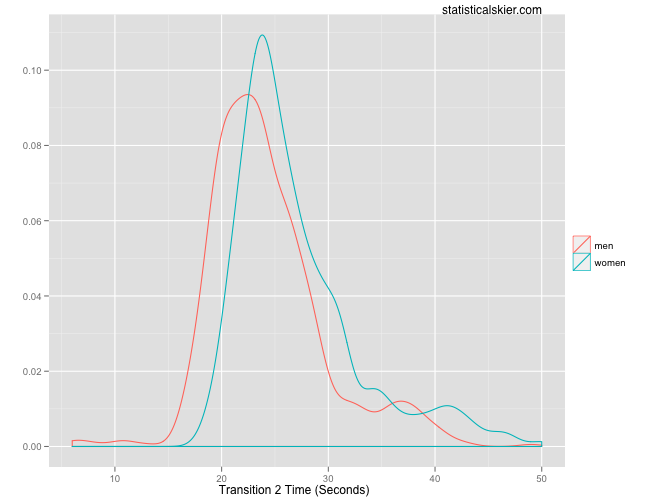
A natural place to start is to figure out exactly how long T2 takes. Â What’s a fast/slow T2 time? Â The median times for men and women are 23 and 25 seconds respectively.
 There are a handful of very fast men’s T2 times (under 15 seconds; a few under 10) that seem suspicious to me, but I suppose it might be possible. Â Roughly speaking, a fast transition appears to be under ~20-22 seconds and slow one would be over ~29-30 seconds, with the men being 2-3 seconds fast than the women.
To get at Adam’s specific question I’m going to focus very narrowly on the number of people each athlete passes during the T2 and Run stages of a race. Â Suppose I pass 4 people during T2; that would be a=-4. Â Then suppose I am passed by 6 people during the run; that would be b=+6. Â The end result would be a+b=+2. Â So I passed 4 people during T2 but ended up 2 places behind where I started. Â The very simplified way to look at this question is to ask: what is the relationship, if any, between a and a+b?
(I’m sure you’re already thinking of complications. Â Don’t worry, we’ll get there!)
Do the people who pass a bunch of competitors during T2 end up losing all that ground by the end of the race? Â Do they stay about the same?
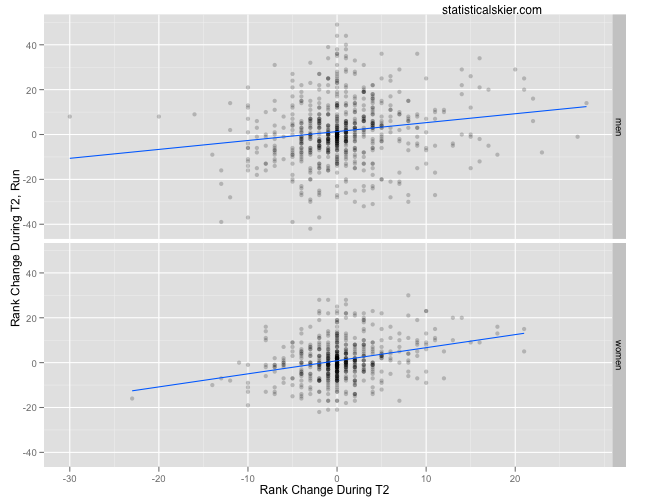
Again, keeping things very simple, we can just look at a scatter plot:
 Remember that negative values here are good; they mean you’ve passed people during T2 (x axis) and that your net change over T2 and the run is to pass people (y axis).
The blue trend lines seem promising, but there’s really not much here. Â The correlations are fairly small (0.17 for the men and 0.29 for the women), however statistically significant they might be. Â Also, we could observe that much of the correlation that does exist is being driven by a small number of points at the extreme ends of the x axis.
Now, that was all very simple. Â Here are a few complications (which I’ve considered and still gotten the same answer):
- The number of people you pass during T2 will depend on how many people there are just in front of you. Â If you look at only those people with large numbers of people just ahead of them coming into T2, you still see little systematic advantage to passing. Â The same is true if you try to adjust for this using ratios (i.e. the proportion of people within X seconds of you that you pass).
- If you look at the raw times for T2, you still see little to no connection between a fast T2 and either a fast run or the number of people passed during T2 and the run.
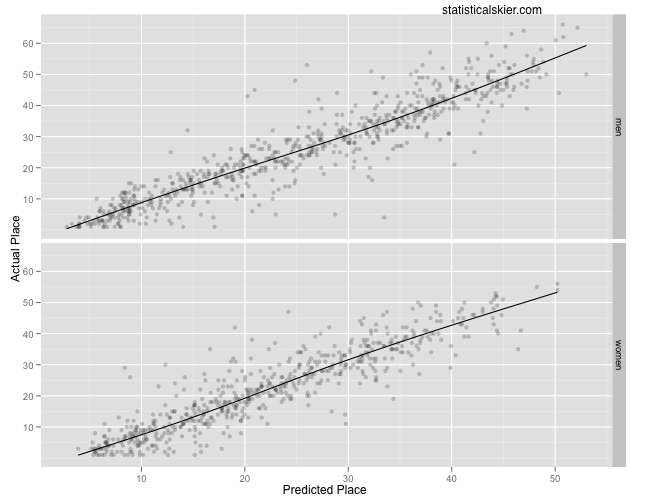
In fact, if you build a model to predict someone’s finishing place using the five segment times, it’s fairly easy to get one that fits quite well, all things considered:
Keep in mind I’m modeling the finishing place, not the time, which would be trivially easy to predict: just add the five times!
Anyway, when you look at which variables are important in this model (I won’t bore you with the details; it’s complicated) the T2 time is the least important part of the model. Â Less important than even the swim or T1.
So what’s the bottom line here? Â Well, like I said above, what this really calls for is an experiment. Â Absent that kind of data, we shouldn’t get too confident in anything we find, even negative results like these. Â However, I simply can’t find any systematic advantage to passing people during T2 as opposed to chilling out behind them.
A key final caveat here is the word “systematic”. Â I’m going to rain on Adam’s parade here a bit (sorry Adam!) and point out that even if we did find some evidence supporting his idea, that wouldn’t necessarily help us know which athletes it might be a good tactic for. Â Confused? Â Here’s the deal. Â Suppose that, on average, passing people during T2 is actually beneficial. Â Since this result (as with most things in statistics) is an average across all athletes, there will of course be some variation. Â Some people will have benefitted from passing people during T2 and some (presumably many fewer) will not have seen any benefit.
But if I’m an actual specific triathlete, how do I know which group I’d be in? Â The only way to know for sure would be to try it: blow by some people in T2 during a race and see what happens.
Which, of course, isn’t to say that this all hasn’t been very interesting, right? Â Right.
[ad#AdSenseBanner]

{ 1 } Trackback
[…] triathlon data I ran into recently happened to give a very stark picture of what happens to the relative importance of each activity […]
Post a Comment