First off, many thanks to Cosmo for the shout out on Twitter. Â My traffic today will be much larger than usual. Â Updated charts after today’s stage (and some new stuff too) below the fold…
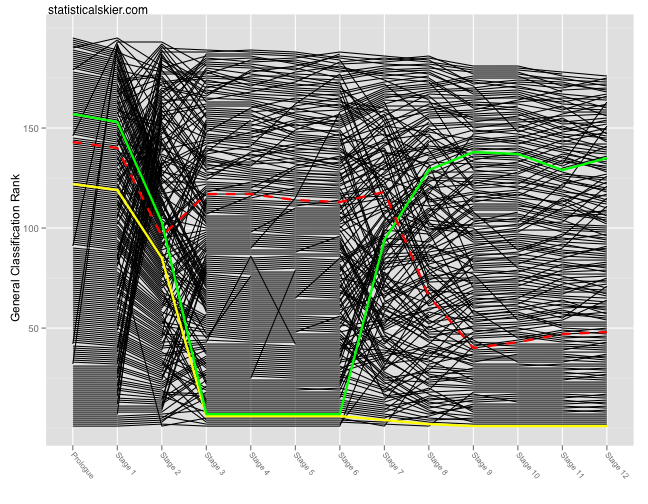
Here’s the updated bumps plot for the GC standings after Stage 12 today:
 The yellow jersey is unchanged (Andy Schleck) but the green jersey for sprinting went back to Thor Hushovd and the polka-dot jersey (red dashed line) for climbing switched to Anthony Charteau (whose name is pleasantly free of non-English characters).
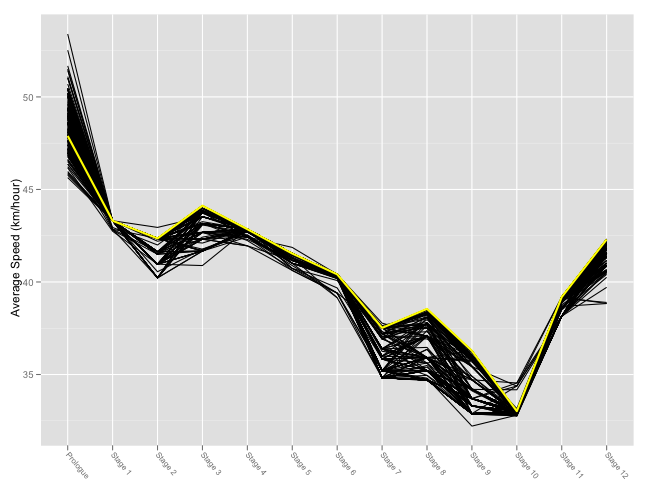
As an added treat, here’s another bumps plot. Â But this time, I’ve shown the average speed in kilometers per hour for each rider and each stage:
 You can easily see here the stages where everyone finishes together (i.e. Stage 1) versus a stage with a lot of variation in speeds (i.e. Stages 8/9 or the Prologue). Â Also, note the group of faster riders in Stage 10, on a particularly slow day. Â Look at the big speed gap from Stage 8 that split the peloton roughly in half. Â Obviously, the yellow line is Andy Schleck, currently yellow jersey holder.
[ad#AdSenseBanner]
{ 2 } Trackbacks
[…] bit of commentary I meant to include last time I posted this average speed graph was that I was mildly surprised at how near the top the Yellow […]
[…] with another Tour stage in the books, I updated the bumps plot to include the latest data. Â Also, I added a bonus bumps chart showing the changes in average […]
Post a Comment