This is another installment in a series (see here and here for important background and setup; if you get confused read them first) where I’ve been looking at comparing performances of rookie skiers on the World Cup. Â In those previous two posts I looked at distance racing, so now it’s time to turn our attention to sprint racing. Â That means that we’re faced with a decision to make: what measure should we use to track performance? Â FIS points or rank? Â Sprint FIS points only refer to an athlete’s qualification speed. Â The final finishing rank (1st, 2nd, etc.) included an athlete’s performance in the elimination round, but any information about the strength of the field, or how close they were to qualifying is lost. Â In past articles, I’ve avoided using FIS points for sprinting, but in this case they contain some useful information. Â Rookie skiers on the World Cup are more likely to fail to qualify for the elimination rounds, meaning their qualification speed is the only real measure we have of their performance.
In the end, there’s no reason not to simply do both. Â It means we’ll have double the graphs to look at, but in my opinion that’s a feature, not a bug! Â In this installment we’ll look at sprint performance as measured by FIS points, and in the next post I’ll examine the same data using rank.
Let’s start with the same set of boxplots we saw in the first two posts:
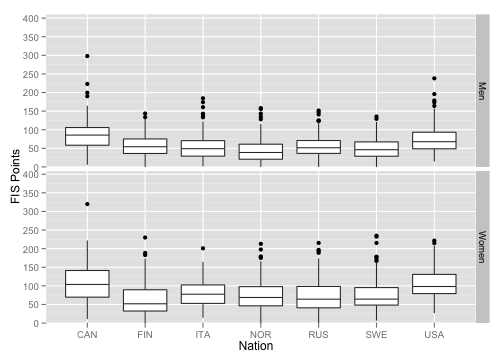
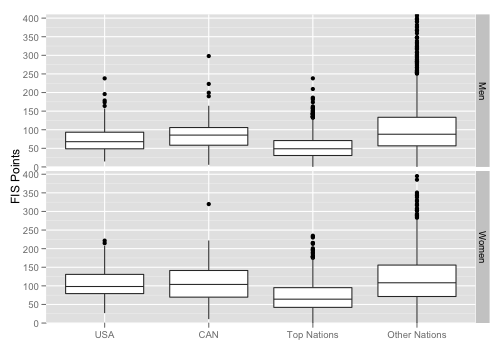
Obviously, since this is sprint racing, we’re only looking at data back to around 2000. Â We don’t really have to worry about catching people mid-career in this case, since sprinting was new for everyone! Â So I’m bending the rules a bit by including veteran racers who were “sprinting rookies” nonetheless. Â If this bothers you, remember that it’s only an issue in the first year or two of the data.
When we look at trends over time, just like in the distance case, we seem some odd overall trends that need to be adjusted for:
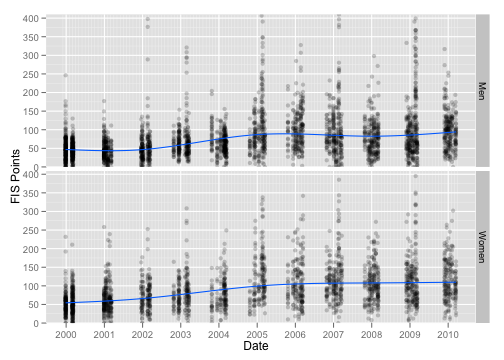
These trends are (perhaps) less mysterious. Â My best guess is that rule or format changes in sprint racing are to blame here. Â In any case, here’s the de-trended data:
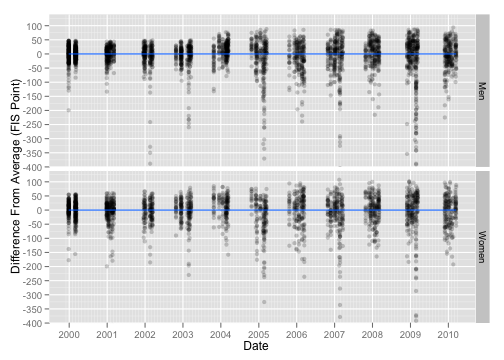
And here it is with the trend lines for each of our four groups:
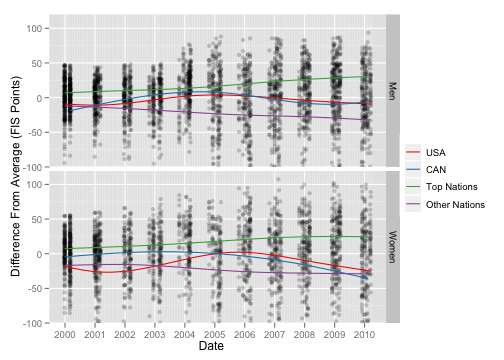
The Canadian and American men appear to have had a similar journey, peaking in the year after the Salt Lake Olympics, but have fallen back a bit since then. Â Rookie performances by American women peaked in 2006 or so and has fallen off considerably since then. Â I’ll leave it to you to speculate about how these trends may or may not overlap with the early parts of particular skiers’ careers from each nation.
I’ll finish up with versions of the remaining two graphs, a zoomed in version of the previous graph and on that splits each group into a separate panel (sorry for the jumbled date labels in the last one; I forgot to angle the labels…):
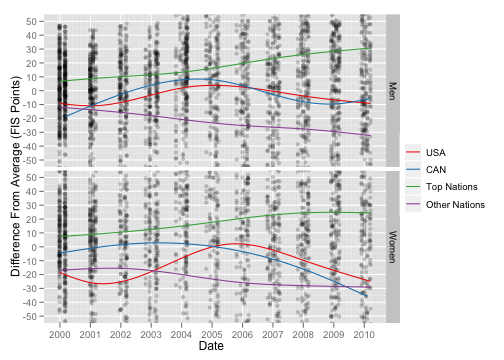
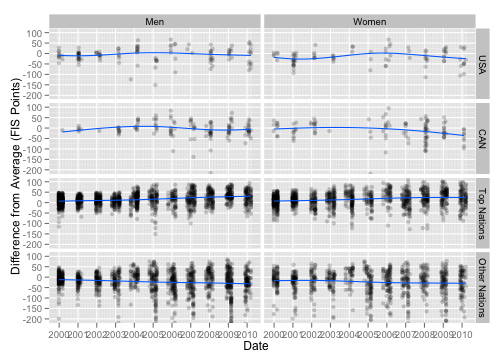
Remember this is all just using sprint FIS points, so it only refers to one’s speed in qualification.
[ad#AdSenseBanner]
Post a Comment