Every season a new crop of young skiers cut their teeth on the World Cup circuit. Â These might be new national team members racing on the World Cup full time, or they might be Nation’s Group athletes who receive a start as part of a host nation’s extra start allotments. Â Each nation likely has a somewhat different strategy for choosing which up and coming athletes are awarded this opportunity. Â One interesting question we can ask is whether there are differences in the level of preparation these athletes have seen between nations, or groups of nations.
The first two installments in this series will look at distance events, and then we’ll turn to sprints.
First we need some working definition of what exactly a “rookie” skier is.  After some tinkering with different definitions, I’ve decided to settle on looking at an athlete’s first seven races in major international events (World Cup, World Championships, Olympics) as their rookie period.  There wasn’t much difference between using 5 or 7 or 9 or so races, and I wanted the number to remain well short of a full season of races because I want to capture skier’s initial performance on the World Cup.
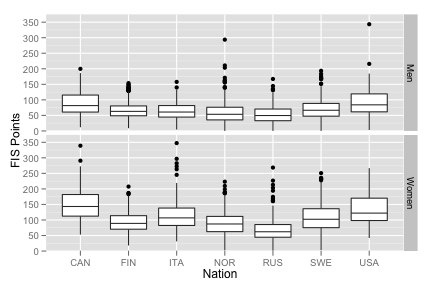
We can’t simply grab each athlete’s first seven races.  My database doesn’t extend beyond the 1991-1992 season, so some athlete’s “first seven races” in my database are actually mid-career.  So we’ll drop any athlete who first pops up in my database in the 1991-1992 or 1992-1993 season, just to be safe.  The first thing we can do is simply look at some boxplots of these athlete’s FIS points by nation:

These plots contain the FIS point scores from the first seven races for all “rookie” skiers from each nation. Â Even aggregated over nearly 17 years of results, there are some differences in performance level by rookie skiers from different nations. Â Obviously, this isn’t the best way to approach this question, but it helps confirm our suspicions that there are indeed differences in how well prepared athletes from different nations are upon entering the international racing scene.
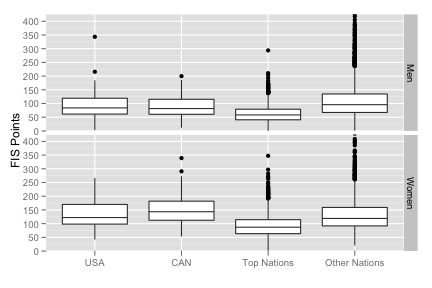
There are many different nations and I’ve just chosen a few to display here. Â Trying to track each nation individually will quickly become unwieldy, so I’m going to collapse the data down into four categories: USA, CAN, Top Nations and Other Nations. Â Top Nations are NOR, SWE, FIN, ITA, GER and RUS. Â Other Nations are just that: every other nation, from Austria to Iran. Â Here’s a boxplot with just these four groups:

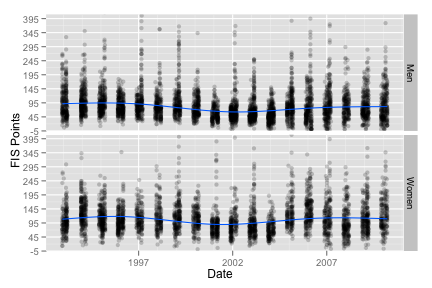
There are still some differences, but again, this is aggregated data over nearly two decades of racing, which is obscuring the picture considerably. Â Instead, let’s look at how these four groups have performed over time. Â This approach is not without some speed bumps, though, as we’ll see in just a moment. Â To lay the groundwork, let’s first just look at all the data over time, as shown below:

While working on this article, this graph had me worried. Â There are some subtle things happening in this graph that are, frankly, weird. Â I don’t have any great explanations; if you do, please let me know in the comments! Â Notice the absence of really fast rookies during much of the 90’s among both men and women. Â Why would this be? Â Why is there a sudden appearance of really fast new male skiers around 2001-2002? Â Why were 2005 and 2006 such bad years for rookie women?
I’m also bothered by the general up and down fluctuations of the average rookie performance over time. Â Any comparisons we want to make between groups needs to account for these changes.
One thing I can explain is the periodic appearance of extremely slow rookies. Â (There are actually even more extreme outliers that I’ve cut off from the graph for display purposes.) Â These most likely correspond to Olympic and World Championship years where we see a lot of skiers from marginal nations.
In the next installment, I’ll describe some adjustments to the data to account for these troubles…
[ad#AdSenseBanner]
Post a Comment