I think most people generally have a sense for how the past World Cup season went for the North Americans. What I’m going to do over the next few posts is to simply show some data that hopefully provides some context for what you already know. I’m going to split them into four posts for men/women and distance/sprint. Today we’ll start with the men’s distance performances.
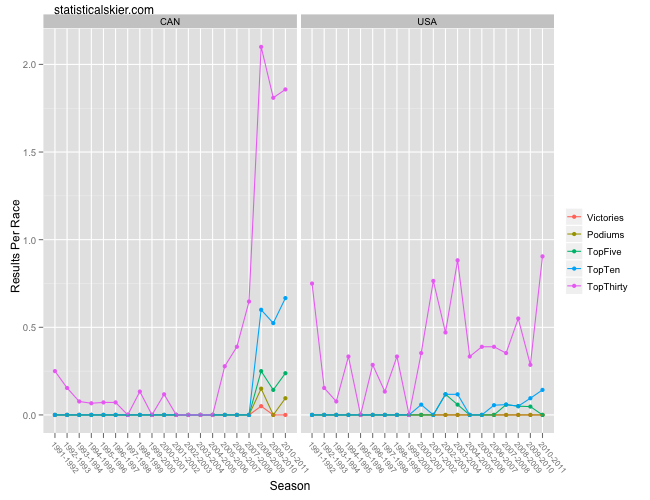
Let’s start with the simplest of metrics, finishing place, and a style of graph that I’ve used before that shows the number of results per race at a given level:
For nations like the US and Canada, that typically have had a very small number of athletes finishing in the top 30, let alone the top ten, just one more result (or one fewer) at a given level can make these lines jump around a fair bit. For instance, Kris Freeman attended the Tour de Ski this year for the first time and skied fairly well. That allowed him to rack up several top thirty performances that he didn’t have last season. Similarly, the increased rate of top ten performances is the result of Freeman adding a 9th place at the Tour de Ski Final Climb to his usual set of two early season top tens. Three US men other than Kris Freeman managed top thirty races this year, and that includes Andrew Newell’s 14th at the Tour de Ski Prologue (Noah Hoffman and Lars Flora are the other two). That compares with six skiers achieving this feat last season (Matt Liebsch, James Southam, Leif Zimmerman, Brenton Knight, Hoffman, Flora) though much of that came from a single sparsely attended pre-Olympic pursuit in January.
The Canadian story is also fairly simple. Despite George Grey struggling for most of the season and some rocky early races from Ivan Babikov, Alex Harvey and Devon Kershaw stepped things up, particularly during the Tour, which led to increased performances almost across the board. They’re still looking for a distance victory, though.
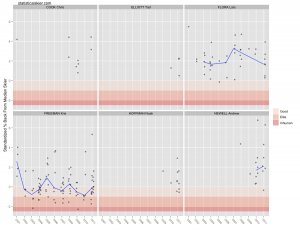
Here’s a look at some of the US men who participated in WC level distance races (the only skiers I’ve omitted are Simi Hamilton and Billy Demong):
 We’ve transitioned to the more subtle metric of standardized percent behind the median skier, here. I think this graph supports my prediction that Noah Hoffman would end up being the best US distance skier after Freeman this year, although you can slice that kind of comparison in lots of different ways. Despite his two early season top ten’s, Freeman had a bit of an off year I think. He skied fairly well at the Tour, but from what I’ve read it sounded like he had some issues with illness related to travelling back and forth to Europe. Sometimes it seems like the North Americans just can’t win either way: living in Europe all winter would be expensive and draining to be away from your friends and family for that long; travelling back and forth (even just once or twice) inevitably takes a toll on the body and increases the risk for getting sick. What makes things worse is that the best solution is probably different for each athlete, which makes coordinating logistics for a whole team quite challenging.
By this measure, Freeman also wasn’t terribly consistent compared to his past seasons, but on the other hand he was in the top 30 in all but 3 of the races he did (~83%) which is second only to his 2008-2009 season (~86%).
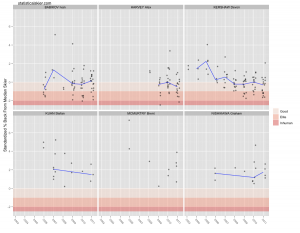
As for the Canadians:
 Although this graph doesn’t make it look dramatic (especially given the excitement surrounding these guys this year) both Harvey and Kershaw saw improvements this year. Remember that the blue trend line is tracking the median for the whole season, and both of these guys had some portions of the season where they weren’t skiing quite as fast. Kershaw in particular struggled towards the end of the season after getting sick, I think.
Obviously, there’s no denying that both these guys had fantastic seasons. There are tons of ways to quantify this, but here’s a single example. Both finished in the top 30 at the highest rate of their careers (Harvey: ~88%, Kershaw ~82%) and more than half the time each was in the top 15 (Harvey: 50%, Kershaw 53%), also career bests. (Harvey managed top-15 results in 4/8 races in 2008-2009 but he did double the number of distance races this season.) The reason I picked this little statistic is that it emphasizes consistency over a single great result. These guys didn’t just pop a great race or two; they seemed to step up their racing across the board every single day.
[ad#AdSenseBanner]

Post a Comment